Hail & Wind Storms in Midland, TX — Latest Dates and Sizes
Hail and wind activity within ~25 miles of Midland, Texas or recorded for its county: the last 12 months from NWS warnings, storm reports, and station measurements, plus official NOAA records back to 2010.
Latest hail and wind near Midland
- Last reported hail (0.75 in.+, screening): June 22, 2026 — 1.50 in. reported 4.3 mi E of Midland, SPC storm report.
- Last wind gust 45 mph+ (screening): September 21, 2026 — 58 mph measured at the Midland International station (7.7 mi SW of Midland) at 5:21 PM CDT, ASOS weather station.
- 2026 so far: 3 hail days and 13 wind days within 25 miles (days with a storm report or station gust at the screening thresholds; warnings alone never count).
| Date | Largest reported hail | Strongest gust |
|---|---|---|
| September 21, 2026 | — | 58 mph measured |
| July 16, 2026 | — | 53 mph measured |
| July 5, 2026 | — | 58 mph measured |
| July 2, 2026 | — | 50 mph measured |
| June 22, 2026 | 1.50 in. reported | — |
| May 31, 2026 | — | 55 mph measured |
| May 23, 2026 | 1.75 in. reported | — |
| May 21, 2026 | 0.75 in. reported | — |
| May 10, 2026 | — | 55 mph measured |
| April 14, 2026 | — | 50 mph measured |
Was your address hit on September 21, 2026? Check any address free with the Free Report Snapshot — a YES/NO estimate at the screening thresholds.
Midland storm facts
- StormAuditor's analysis of NOAA and National Weather Service records found 70 wind and hail events, NWS warning products included, within 25 miles of Midland, Texas or recorded for Midland County in the 12 months ending October 7, 2026 (42 wind, 28 hail).
- The strongest gust within 25 miles of Midland in the last 12 months was 67 mph, measured at the Midland International station (7.7 mi SW of Midland) on March 15, 2026 (ASOS weather station; storm reports and station gusts only, warnings excluded).
- The largest hail reported within 25 miles of Midland in the last 12 months was 1.75 in., 18.4 mi E of Midland (Stanton) on May 23, 2026 (SPC storm report).
- The busiest day by event count near Midland was June 22, 2026, with 7 events.
- Midland County alone recorded 55 of those wind and hail events (30 wind, 25 hail); the Texas page ranks counties by events of every type, floods and Special Weather Statements included.

Midland, Texas storm history at a glance (last 12 months)
This free weather history for Midland — home to about 140,000 residents — draws on StormAuditor's consolidated public record: 70 wind and hail events within 25 miles of Midland or recorded for Midland County in the trailing 12 months — 42 wind and 28 hail.
Events combine NWS warning products, observed Local Storm Reports, station measurements and official NCEI records in one event table. Because they include warnings, and wind covers thunderstorm and non-thunderstorm wind alike, they measure something different from the NCEI entry counts in the history section below; the two are not comparable year to year.
Busiest days near Midland by event count
Ranked by the number of 12-month events, NWS warnings included, so a day with many warnings can outrank a day with larger hail.
- June 22, 2026 — 7 events incl. warnings · 1 wind · 6 hail
- May 23, 2026 — 6 events incl. warnings · 1 wind · 5 hail
- October 23, 2025 — 5 events incl. warnings · 4 wind · 1 hail
- July 5, 2026 — 4 events incl. warnings · 3 wind · 1 hail
- November 20, 2025 — 4 events incl. warnings · 4 wind
How these numbers are counted
The storm numbers on this page are counted in four different ways, plus the free address check. Each answers a different question with its own size cutoffs, area and time span, so compare numbers within one group, not across groups.
- Storm days (latest hail and wind): A day in the last 12 months when at least one report within 25 miles of Midland showed hail 0.75 in. or larger or wind of 45 mph or more (StormAuditor screening thresholds). Reports are NWS storm reports from spotters, the public and officials, plus weather-station gusts, which count from 50 mph. A warning on its own never makes a storm day. The latest and largest hail, the latest and strongest gust, and the storm-day table all use this record.
- Storm-date pages (NWS severe): A storm-date page is published only when at least one report or station gust within 25 miles of a city met the National Weather Service severe criteria (hail 1.00 in. or larger, or wind 58 mph or more), at least two separate observations were logged, and the day ranks among the most significant. A storm report that relays an airport weather station's reading (the same station, the same gust and the same time) counts once, as the station reading. Not every storm day gets a page; when one does, the page and the storm-day table show the same largest hail and strongest gust.
- Events (12-month counts): Events count NWS warnings, storm reports (wind 50 mph+, hail 0.75 in.+), station gusts (50 mph+) and NCEI entries within 25 miles of Midland or recorded for Midland County, tornado entries counted as wind. One event is one place on one day, counted separately for hail and for wind. A weather station or storm-report point counts once a day, at that day's highest reading, however many readings it filed; a place with hail and wind on the same day is two events. NWS warnings count once per county per day, and each NCEI entry once per place per day. A storm report that relays an airport weather station's reading (the same station, the same gust and the same time) counts once, as the station reading. The same report arriving through another feed (SPC or NCEI) is one record. Events measure how busy the area was, not whether a storm hit: one storm can bring warnings and reports from many places, so the busiest days by event count can differ from the storm days.
- NOAA history (since 2010): The official NOAA storm record (NCEI Storm Events) within 25 miles of Midland or in Midland County from January 1, 2010 to the day before the 12-month window starts: hail 0.50 in.+, thunderstorm wind 40 mph+ and tornadoes. It is a separate, older record with its own "storm days" (days with any entry), so its counts are not compared with the 12-month numbers.
- Free Report Snapshot: A free YES/NO estimate for one address, from radar and wind analysis at the property rather than area reports, at the same screening thresholds: hail 0.75 in. or wind 45 mph.
Full method: Methodology and Data Sources.
Midland hail and wind history in NOAA NCEI records, 2010–Oct. 2025
This section covers January 1, 2010 through October 6, 2025. Storms from October 7, 2025 on are in the 12-month summary above, so no date is counted in both.
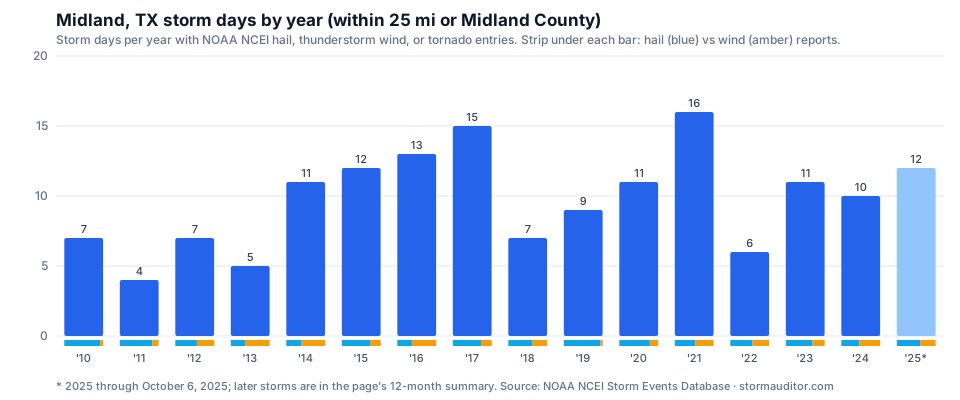
The National Centers for Environmental Information logged 156 storm days within 25 miles of Midland or in Midland County in this period — 549 NCEI Storm Events entries in all. Hail outnumbers thunderstorm wind here: 348 hail reports against 191 wind reports.
The largest hail in these records for this area was 5.00 in. (larger than softball size), reported on June 14, 2017 in Ector County. Hail of 2 inches or more appears in 11 different years of this record, the latest being 2025 through Oct. 6. Measured thunderstorm gusts topped out at 112 mph (Midland County, April 22, 2025). NCEI also lists 10 tornado entries for the area — one entry per county a tornado crossed.
Hail and wind both peak in June, the month with 39% of the hail reports. December through February accounts for 5 storm days.
Storm days ranged from 4 in 2011 to 16 in 2021. Across 2022–2024, the area averaged 9.0 storm days a year, below the 15-year average of 9.6. The latest five full years (2020–2024) averaged 11 storm days, up from 6.8 in 2010–2014.
- Average: 9.6 storm days a year (2010–2024)
- May and June: 76% of all hail reports
- Most hail reports in one year: 64 in 2017
- Hail of 1 in. or larger reported in every full year, 2010–2024
| Year | Hail reports | Thunderstorm wind reports | Tornado entries | Storm days | Largest hail | Strongest measured gust |
|---|---|---|---|---|---|---|
| 2010 | 12 | 1 | 2 | 7 | 1.75 in. | — |
| 2011 | 5 | 1 | 0 | 4 | 1.75 in. | — |
| 2012 | 5 | 4 | 1 | 7 | 2.00 in. | — |
| 2013 | 4 | 7 | 0 | 5 | 1.75 in. | 62 mph |
| 2014 | 11 | 17 | 0 | 11 | 1.25 in. | 64 mph |
| 2015 | 29 | 11 | 0 | 12 | 2.75 in. | 75 mph |
| 2016 | 12 | 20 | 1 | 13 | 1.75 in. | 69 mph |
| 2017 | 64 | 24 | 0 | 15 | 5.00 in. | 74 mph |
| 2018 | 11 | 7 | 0 | 7 | 2.50 in. | 60 mph |
| 2019 | 48 | 3 | 3 | 9 | 3.00 in. | — |
| 2020 | 33 | 9 | 0 | 11 | 3.00 in. | 68 mph |
| 2021 | 19 | 17 | 0 | 16 | 2.50 in. | 69 mph |
| 2022 | 12 | 9 | 0 | 6 | 4.00 in. | 74 mph |
| 2023 | 31 | 14 | 0 | 11 | 2.00 in. | 68 mph |
| 2024 | 25 | 29 | 3 | 10 | 4.00 in. | 76 mph |
| 2025 through Oct. 6 | 27 | 18 | 0 | 12 | 2.50 in. | 112 mph |
Download this history: CSV · JSON at https://www.stormauditor.com/downloads/storm-history/tx/midland.json (free, open license, cite StormAuditor).
Source: NOAA NCEI Storm Events Database (thunderstorm wind, hail, and tornado entries; hail 0.50 in. or larger, wind 40 mph or more; wind converted from knots).
Midland storm history questions, 2010–Oct. 2025
What is the largest hail reported near Midland, 2010–Oct. 2025?
5.00 in., larger than softball size, reported on June 14, 2017 in Ector County, per NCEI. Hail of 2 inches or more appears in 11 years of this record in all, most recently 2023, 2024 and 2025 through Oct. 6.
What was Midland's most active storm year, 2010–Oct. 2025?
2021, with 16 storm days (19 hail reports, 17 thunderstorm wind reports). The 15-year average is 9.6 storm days.
How often does Midland get hail?
NCEI's records average 21 hail reports a year here over 2010–2024, alongside 12 thunderstorm wind reports. Hail of 1 inch or larger was reported in every one of those years.
When is hail season near Midland?
June has the most hail reports (134, 2010–Oct. 2025), followed by May (129) and April (38).
How strong were measured thunderstorm winds in Midland, 2010–Oct. 2025?
112 mph, measured on April 22, 2025 in Midland County. Only gusts NCEI lists as measured count here; gusts measured on a date and county with a tornado entry, and entries of 120 knots or more (known entry errors), are left out.
Midland hail map and wind map
Researching hail or wind in Midland? The Hail Explorer and Wind Explorer map radar-derived hail swaths and peak-gust wind swaths across Texas, including the Midland metro: pick any storm date and see how estimated hail size and gust bands tracked through Midland County. Both explorers are included with Pro+ and Organization plans.
County-level activity is on the Impact Heatmap (free with an account), and day-by-day history is on the Storm Calendar (Pro plans and higher).
Free Midland weather report by address
Area maps show where storms tracked; an insurance claim or roof inspection turns on what happened at the property. Three ways to check one Midland address:
- The Free Report Snapshot answers YES/NO instantly on estimated wind of 45 mph or more and hail of 0.75 in. or larger (screening thresholds) at the address.
- The free Address Lookup lists NWS warnings, storm reports and NOAA observations near the address — free Midland wind history and free Midland hail history.
- A complete Weather Report for $2.99 covers every qualifying storm date at one address over the last 2 years.
All values are estimates from public NOAA data under our published methodology (see Limitations).
For roofers, adjusters, and claim attorneys: the professional tools add statewide hail and wind swath maps, the Zone Canvas Tool, and Audit Reports with the evidence and arithmetic — see how roofing contractors and insurance claim attorneys use them.
Sources: NWS alerts (api.weather.gov) · NWS Local Storm Reports via the Iowa Environmental Mesonet · ASOS/AWOS station gusts via the Iowa Environmental Mesonet · NOAA NCEI Storm Events Database · every StormAuditor data source.
Free Midland storm data download
The Midland storm records for the last 12 months download free, free to reuse under the data license: download CSV · JSON at https://www.stormauditor.com/downloads/storm-data/tx/midland.json.
- Coverage: every wind and hail record within about 25 miles of Midland or recorded for Midland County, with dates, counties, event types, measured gusts and hail sizes.
- Rows: each source record before consolidation, including every NWS warning product and smaller storm reports, so the row count differs from the event counts above.
- Statewide files are on the Texas storm data page.
Nearby city storm pages:
- Odessa hail & wind history
- Hobbs, NM hail & wind history
- San Angelo hail & wind history
- Lubbock hail & wind history
- Levelland hail & wind history
- Abilene hail & wind history
- Texas statewide storm data
Guides for reading this data
Cite or link to this data — free
Free to quote, summarize, reuse, and link — for bloggers, journalists, researchers, contractors, and AI writing tools. No permission or credit required. A ready-made citation and link are below if they help. Terms: StormAuditor data & content license.
Citation: StormAuditor. "Midland, TX Hail & Wind Storm History." Updated September 30, 2026. https://www.stormauditor.com/storm-data/tx/midland
HTML link: <a href="https://www.stormauditor.com/storm-data/tx/midland">Midland, TX Hail & Wind Storm History — StormAuditor</a>
About this page: built by Storm Auditor LLC from public NOAA/NWS records — deduplicated warnings, storm reports, station measurements, and official records on a rolling 12-month window, under the published methodology. See the StormAuditor Editorial Team for how content is produced.
Data last refreshed October 7, 2026. Event counts cover wind and hail (warning products, and storm reports from 50 mph or 0.75 in.); flood activity and Special Weather Statements are not counted here.