Weather Reports for Roofing Contractors
Statewide hail maps and wind swaths to find where storms hit — and per-address reports to document what the public weather record shows at each roof.
Finding storm-affected areas after a hail or wind day
Four steps take you from "it stormed yesterday" to the specific streets the storm crossed and a document for each roof — each step narrowing the area before anyone gets in a truck.
Find the storm day
The Storm Calendar lays out your state's storm activity day by day, with county detail, so you know which days are worth a closer look.
Pro
See where it hit
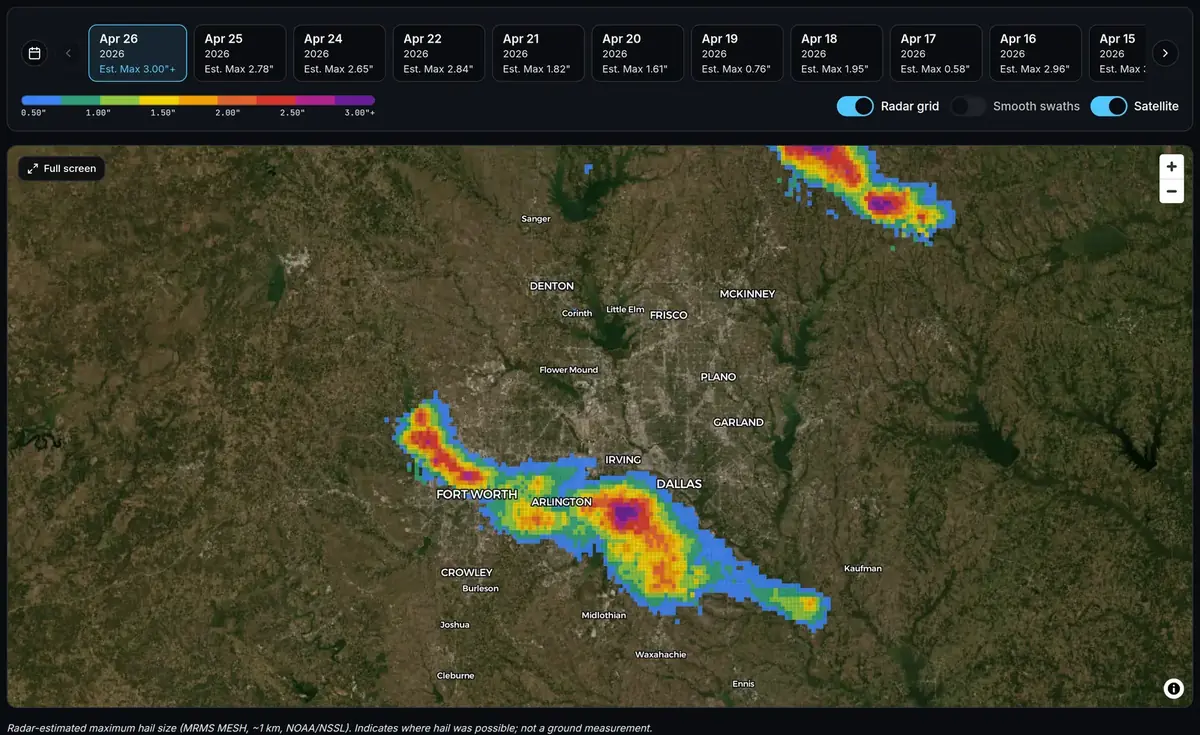
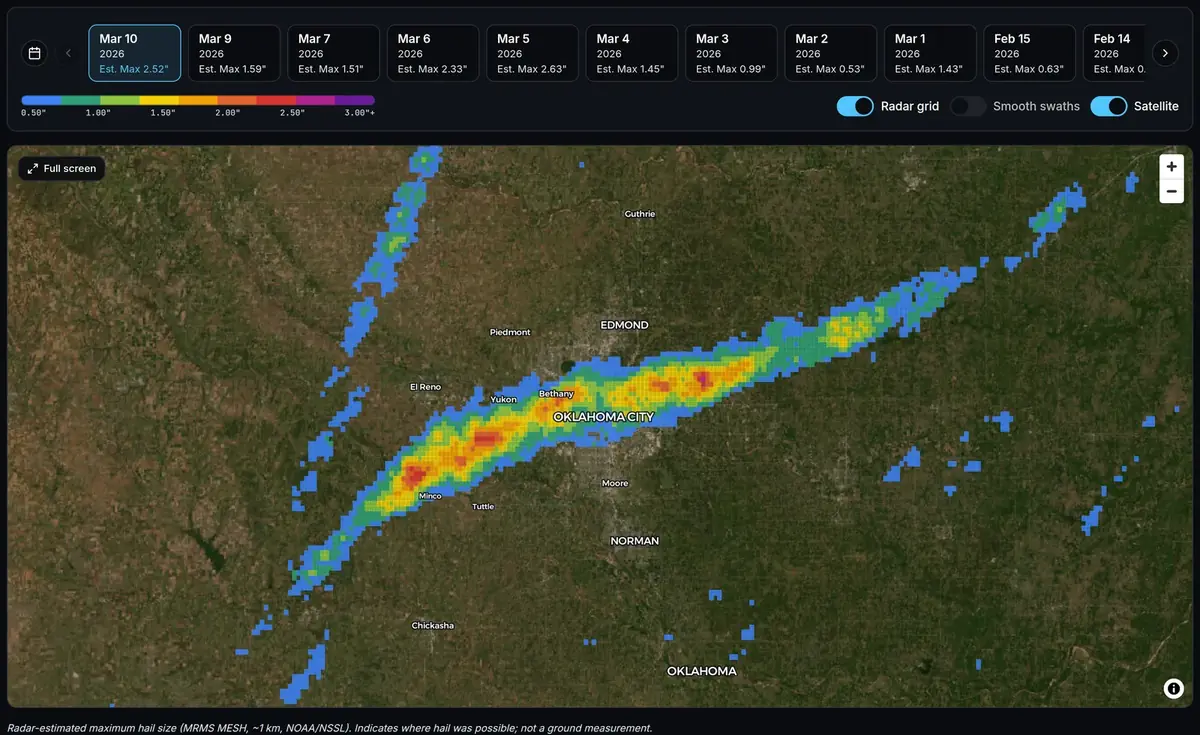
Open the hail map or wind map for that date to see which towns and neighborhoods the swath crossed, color-coded by estimated hail size or peak gust.
Pro+
Outline your territory
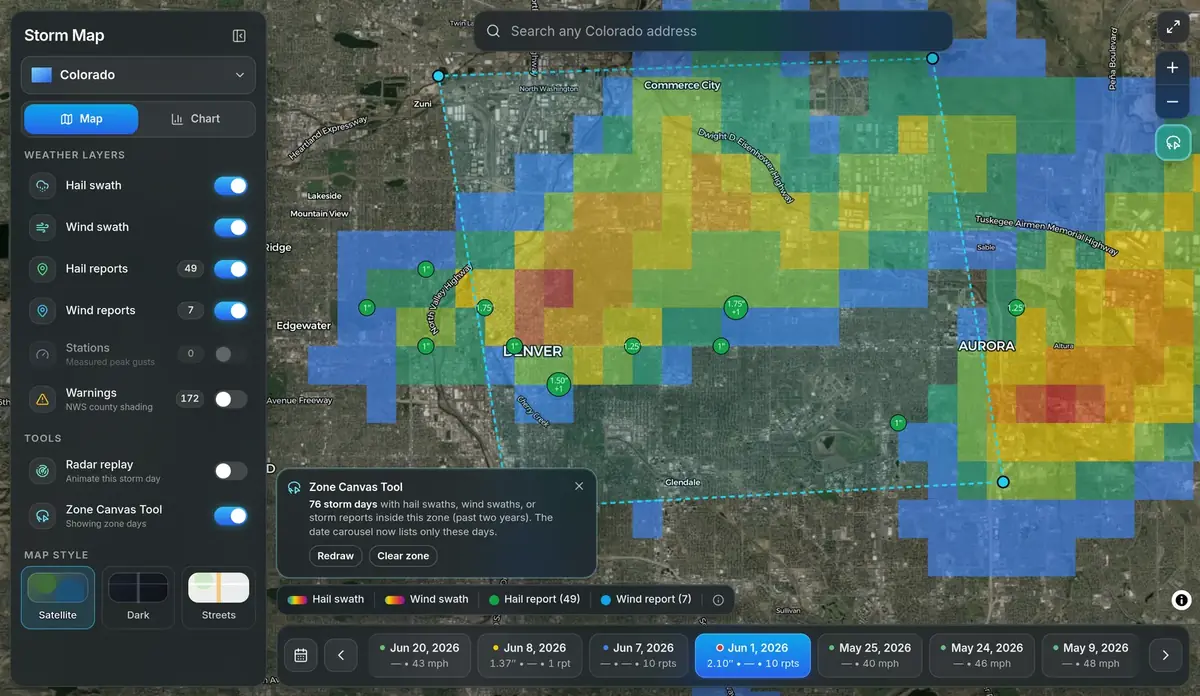
Outline a canvassing area of up to 2,500 sq mi with four clicks in the Zone Canvas Tool and get every storm day in the last two years with hail, wind, or storm reports inside it.
Pro+
Document each roof
Pull a Weather Report for each property and leave the homeowner a PDF with every qualifying storm date at their address.
$2.99 single · Pro 5/day · Pro+ 25/day
Hail and wind at the address
This is hail data for roofers, and each per-address report doubles as a weather report for roof damage research. Hail estimates come from NOAA MRMS MESH radar data on a grid of about 1 km, as the hail methodology documents. The free hail size guide lists the damage possible at each hail size, pea through softball, for roofs, siding, windows, and soft metals such as gutters and AC fins — useful for setting expectations before you climb.
Wind estimates start from the NWS analysis of record and are corrected with measured gusts from ASOS/AWOS airport weather stations and measured NWS storm reports under the published wind methodology. When a homeowner remembers "the big windstorm in March," a Weather Report shows the dates and estimated gusts at their property.
Give the homeowner a document they can use
Every value in a StormAuditor report is computed from public weather records — NOAA radar and analyses, airport weather stations, and NWS storm reports — under a published method, and the report names its sources. Your inspection establishes the condition of the roof; the report shows the estimated weather at the address.
When one storm date needs the full reasoning, the Audit Report maps the instruments that carry the most weight, lists each one's distance from the property and what it measured, and shows the arithmetic behind the estimate.
See the swath before you send a crew. Open the hail map · Create a free account
Roofer questions
How do roofers use a hail map?
A hail swath map shows the radar-estimated maximum hail size in each ~1 km cell on a given day. Roofing contractors use the statewide hail map to see which neighborhoods a storm crossed before committing canvassing time, then pull a Weather Report for the properties they work.
Can I check a whole subdivision instead of one address at a time?
Yes. With the Zone Canvas Tool (Pro+, $9.99/mo) you outline an area on the Storm Map Dashboard with four clicks and get every storm day in the last two years with hail, wind, or storm reports inside it.
Can I get a weather report for a specific roof?
Yes. Enter the address and the Weather Report lists every qualifying storm date at the property. A single report is $2.99 with no subscription; Pro includes 5 reports a day and Pro+ includes 25.
Does the report determine roof damage?
No. The report shows the estimated weather at the address from public NOAA data. Whether a roof is damaged is established by inspection; the report gives the weather side of the file to pair with your inspection photos.
What's the best hail map for roofers?
One that shows radar-estimated hail size by date across a whole state, lets you outline a canvassing territory, and produces a per-address report to hand the homeowner. StormAuditor's hail map does all three from NOAA MRMS radar data; the storm tool comparison sets it side by side with HailTrace, Interactive Hail Maps, and the free NOAA sources.
StormAuditor for other professionals
Public Adjusters · Insurance Adjusters · Claim Attorneys · Restoration & Exterior · Teams & Firms · Storm data for professionals · For homeowners