Hail & Wind Storms in Honolulu, HI — Latest Dates and Sizes
Hail and wind activity within ~25 miles of Honolulu, Hawaii or recorded for its county: the last 12 months from NWS warnings, storm reports, and station measurements, plus official NOAA records back to 2010.
Latest hail and wind near Honolulu
- Last reported hail (0.75 in.+, screening): none reported within 25 miles in the last 12 months.
- Last wind gust 45 mph+ (screening): September 27, 2026 — 54 mph reported in Honolulu (2 NNW Makiki), NWS Local Storm Report.
- 2026 so far: no hail days and 8 wind days within 25 miles (days with a storm report or station gust at the screening thresholds; warnings alone never count).
| Date | Largest reported hail | Strongest gust |
|---|---|---|
| September 27, 2026 | — | 54 mph reported |
| September 7, 2026 | — | 71 mph measured |
| August 16, 2026 | — | 67 mph measured |
| August 15, 2026 | — | 74 mph measured |
| April 9, 2026 | — | 69 mph measured |
| March 13, 2026 | — | 78 mph measured |
| February 8, 2026 | — | 64 mph measured |
| February 2, 2026 | — | 51 mph measured |
Was your address hit on September 27, 2026? The free Address Lookup lists NWS warnings, storm reports and station observations near any address.
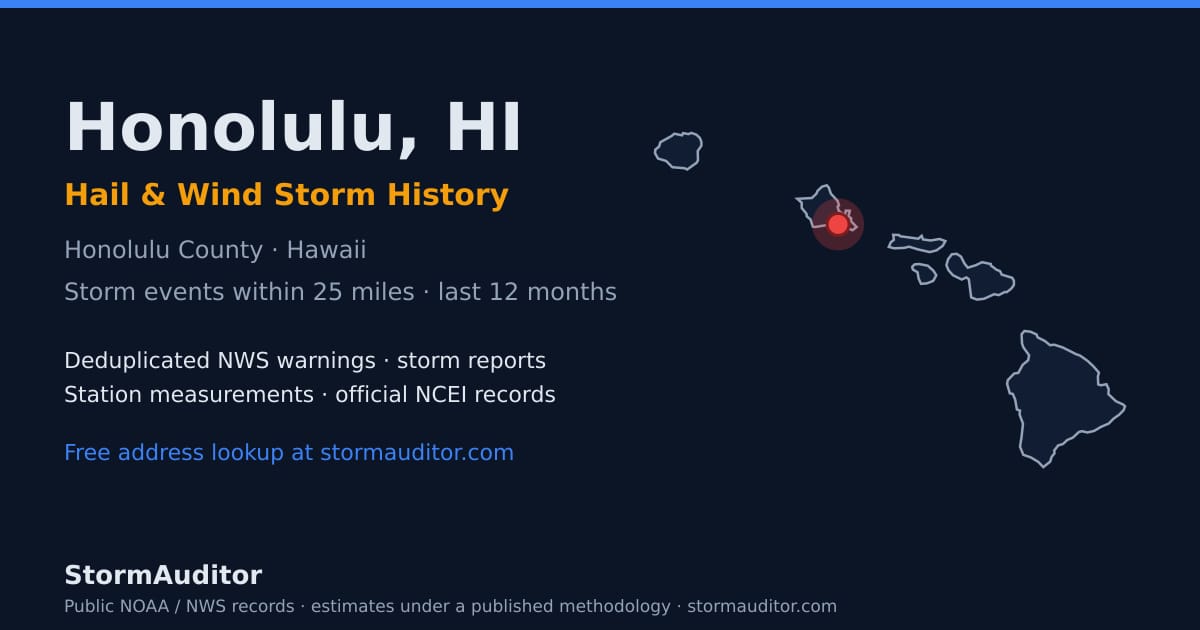
Honolulu storm facts
- StormAuditor's analysis of NOAA and National Weather Service records found 43 wind events, NWS warning products included, within 25 miles of Honolulu, Hawaii or recorded for Honolulu County in the 12 months ending October 7, 2026.
- The strongest gust within 25 miles of Honolulu in the last 12 months was 78 mph, measured 21.6 mi NW of Honolulu (3 NW Schofield Barracks) on March 13, 2026 (NWS Local Storm Report; storm reports and station gusts only, warnings excluded).
- The busiest day by event count near Honolulu was September 7, 2026, with 13 events.
- Honolulu County alone recorded 43 of those wind and hail events, all wind; the Hawaii page ranks counties by events of every type, floods and Special Weather Statements included.
Honolulu, Hawaii storm history at a glance (last 12 months)
This free weather history for Honolulu — home to about 340,000 residents — draws on StormAuditor's consolidated public record: 43 wind events within 25 miles of Honolulu or recorded for Honolulu County in the trailing 12 months.
Events combine NWS warning products, observed Local Storm Reports, station measurements and official NCEI records in one event table. Because they include warnings, and wind covers thunderstorm and non-thunderstorm wind alike, they measure something different from the NCEI entry counts in the history section below; the two are not comparable year to year.
Busiest days near Honolulu by event count
Ranked by the number of 12-month events, NWS warnings included, so a day with many warnings can outrank a day with larger hail.
- September 7, 2026 — 13 events incl. warnings · 13 wind
- March 13, 2026 — 9 events incl. warnings · 9 wind · storm-date page: 5 storm reports
- September 27, 2026 — 4 events incl. warnings · 4 wind
- February 8, 2026 — 4 events incl. warnings · 4 wind
- August 16, 2026 — 3 events incl. warnings · 3 wind
Storm-day records for Honolulu
Storm-date pages for the biggest days near Honolulu: a report or station gust within 25 miles met NWS severe criteria (hail 1.00 in.+ or wind 58 mph+), with at least two separate observations. Not every storm day in the table above has a page. Each page lists the reports, station gusts and a free way to check one address:
How these numbers are counted
The storm numbers on this page are counted in four different ways. Each answers a different question with its own size cutoffs, area and time span, so compare numbers within one group, not across groups.
- Storm days (latest hail and wind): A day in the last 12 months when at least one report within 25 miles of Honolulu showed hail 0.75 in. or larger or wind of 45 mph or more (StormAuditor screening thresholds). Reports are NWS storm reports from spotters, the public and officials, plus weather-station gusts, which count from 50 mph. A warning on its own never makes a storm day. The latest and largest hail, the latest and strongest gust, and the storm-day table all use this record.
- Storm-date pages (NWS severe): A storm-date page is published only when at least one report or station gust within 25 miles of a city met the National Weather Service severe criteria (hail 1.00 in. or larger, or wind 58 mph or more), at least two separate observations were logged, and the day ranks among the most significant. A storm report that relays an airport weather station's reading (the same station, the same gust and the same time) counts once, as the station reading. Not every storm day gets a page; when one does, the page and the storm-day table show the same largest hail and strongest gust.
- Events (12-month counts): Events count NWS warnings, storm reports (wind 50 mph+, hail 0.75 in.+), station gusts (50 mph+) and NCEI entries within 25 miles of Honolulu or recorded for Honolulu County, tornado entries counted as wind. One event is one place on one day, counted separately for hail and for wind. A weather station or storm-report point counts once a day, at that day's highest reading, however many readings it filed; a place with hail and wind on the same day is two events. NWS warnings count once per county per day, and each NCEI entry once per place per day. A storm report that relays an airport weather station's reading (the same station, the same gust and the same time) counts once, as the station reading. The same report arriving through another feed (SPC or NCEI) is one record. Events measure how busy the area was, not whether a storm hit: one storm can bring warnings and reports from many places, so the busiest days by event count can differ from the storm days.
- NOAA history (since 2010): The official NOAA storm record (NCEI Storm Events) within 25 miles of Honolulu or in Honolulu County from January 1, 2010 to the day before the 12-month window starts: hail 0.50 in.+, thunderstorm wind 40 mph+ and tornadoes. It is a separate, older record with its own "storm days" (days with any entry), so its counts are not compared with the 12-month numbers.
Full method: Methodology and Data Sources.
Honolulu hail and wind history in NOAA NCEI records, 2010–Oct. 2025
This section covers January 1, 2010 through October 6, 2025. Storms from October 7, 2025 on are in the 12-month summary above, so no date is counted in both.
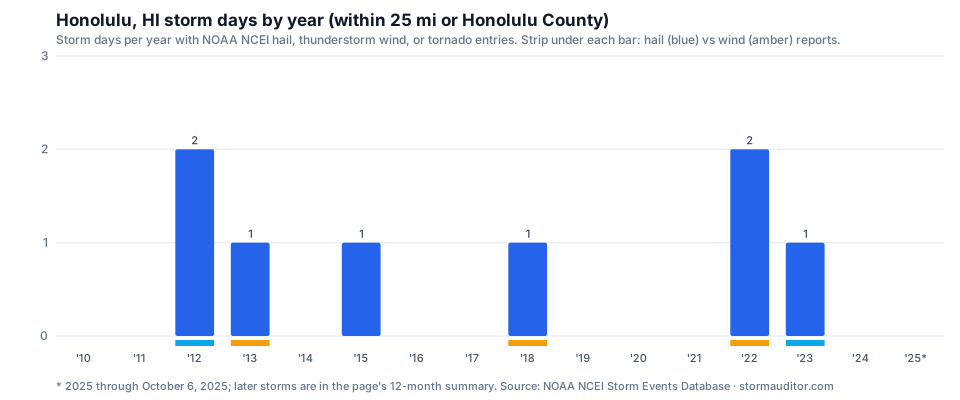
The National Centers for Environmental Information logged 8 storm days within 25 miles of Honolulu or in Honolulu County in this period — 14 NCEI Storm Events entries in all. The entries include 7 hail reports and 5 thunderstorm wind reports.
On March 9, 2012, 4.25 in. (larger than grapefruit size) hail was reported in Honolulu County — the largest in these records for this area. Hail of 2 inches or more appears in only one year of this record, 2012. NCEI also lists 2 tornado entries for the area — one entry per county a tornado crossed.
- Average: 0.5 storm days a year (2010–2024)
- Most hail reports in one year: 6 in 2012
- Hail of 1 in. or larger reported in 2 of 15 full years (2010–2024)
| Year | Hail reports | Thunderstorm wind reports | Tornado entries | Storm days | Largest hail | Strongest measured gust |
|---|---|---|---|---|---|---|
| 2010 | 0 | 0 | 0 | 0 | — | — |
| 2011 | 0 | 0 | 0 | 0 | — | — |
| 2012 | 6 | 0 | 1 | 2 | 4.25 in. | — |
| 2013 | 0 | 1 | 0 | 1 | — | — |
| 2014 | 0 | 0 | 0 | 0 | — | — |
| 2015 | 0 | 0 | 1 | 1 | — | — |
| 2016 | 0 | 0 | 0 | 0 | — | — |
| 2017 | 0 | 0 | 0 | 0 | — | — |
| 2018 | 0 | 1 | 0 | 1 | — | — |
| 2019 | 0 | 0 | 0 | 0 | — | — |
| 2020 | 0 | 0 | 0 | 0 | — | — |
| 2021 | 0 | 0 | 0 | 0 | — | — |
| 2022 | 0 | 3 | 0 | 2 | — | — |
| 2023 | 1 | 0 | 0 | 1 | 1.25 in. | — |
| 2024 | 0 | 0 | 0 | 0 | — | — |
| 2025 through Oct. 6 | 0 | 0 | 0 | 0 | — | — |
Download this history: CSV · JSON at https://www.stormauditor.com/downloads/storm-history/hi/honolulu.json (free, open license, cite StormAuditor).
Source: NOAA NCEI Storm Events Database (thunderstorm wind, hail, and tornado entries; hail 0.50 in. or larger, wind 40 mph or more; wind converted from knots).
Honolulu storm history questions, 2010–Oct. 2025
How big did hail get in Honolulu, 2010–Oct. 2025?
4.25 in., larger than grapefruit size, reported on March 9, 2012 in Honolulu County, per NCEI.
Which year had the most storm days near Honolulu, 2010–Oct. 2025?
2012 and 2022 tied, with 2 storm days each. The 15-year average is 0.5 storm days.
How many hail reports does Honolulu see in a typical year?
About 0.5 hail reports a year (2010–2024 average), with 1-inch or larger hail in 2 of 15 years. Thunderstorm wind averages 0.3 reports a year.
Honolulu storm records and research tools
For Honolulu, research storms with the NWS warnings, storm reports and station measurements summarized above, the NOAA history on this page, the free Address Lookup (warnings and reports near an address) and the Storm Calendar (Pro plans and higher). All values follow our published methodology (see Limitations).
Storm professionals: restoration and exterior contractors, public adjusters, and crews and teams on one Organization plan work from this same public record — see StormAuditor for professionals.
Sources: NWS alerts (api.weather.gov) · NWS Local Storm Reports via the Iowa Environmental Mesonet · ASOS/AWOS station gusts via the Iowa Environmental Mesonet · NOAA NCEI Storm Events Database · every StormAuditor data source.
Free Honolulu storm data download
The Honolulu storm records for the last 12 months download free, free to reuse under the data license: download CSV · JSON at https://www.stormauditor.com/downloads/storm-data/hi/honolulu.json.
- Coverage: every wind and hail record within about 25 miles of Honolulu or recorded for Honolulu County, with dates, counties, event types, measured gusts and hail sizes.
- Rows: each source record before consolidation, including every NWS warning product and smaller storm reports, so the row count differs from the event counts above.
- Statewide files are on the Hawaii storm data page.
See the full Hawaii storm data page for statewide statistics.
Guides for reading this data
Cite or link to this data — free
Free to quote, summarize, reuse, and link — for bloggers, journalists, researchers, contractors, and AI writing tools. No permission or credit required. A ready-made citation and link are below if they help. Terms: StormAuditor data & content license.
Citation: StormAuditor. "Honolulu, HI Hail & Wind Storm History." Updated September 27, 2026. https://www.stormauditor.com/storm-data/hi/honolulu
HTML link: <a href="https://www.stormauditor.com/storm-data/hi/honolulu">Honolulu, HI Hail & Wind Storm History — StormAuditor</a>
About this page: built by Storm Auditor LLC from public NOAA/NWS records — deduplicated warnings, storm reports, station measurements, and official records on a rolling 12-month window, under the published methodology. See the StormAuditor Editorial Team for how content is produced.
Data last refreshed October 7, 2026. Event counts cover wind and hail (warning products, and storm reports from 50 mph or 0.75 in.); flood activity and Special Weather Statements are not counted here.